
Infrastructure
Infrastructure
Exercise 1: Kibana
Kibana is published by Ingress Controller.
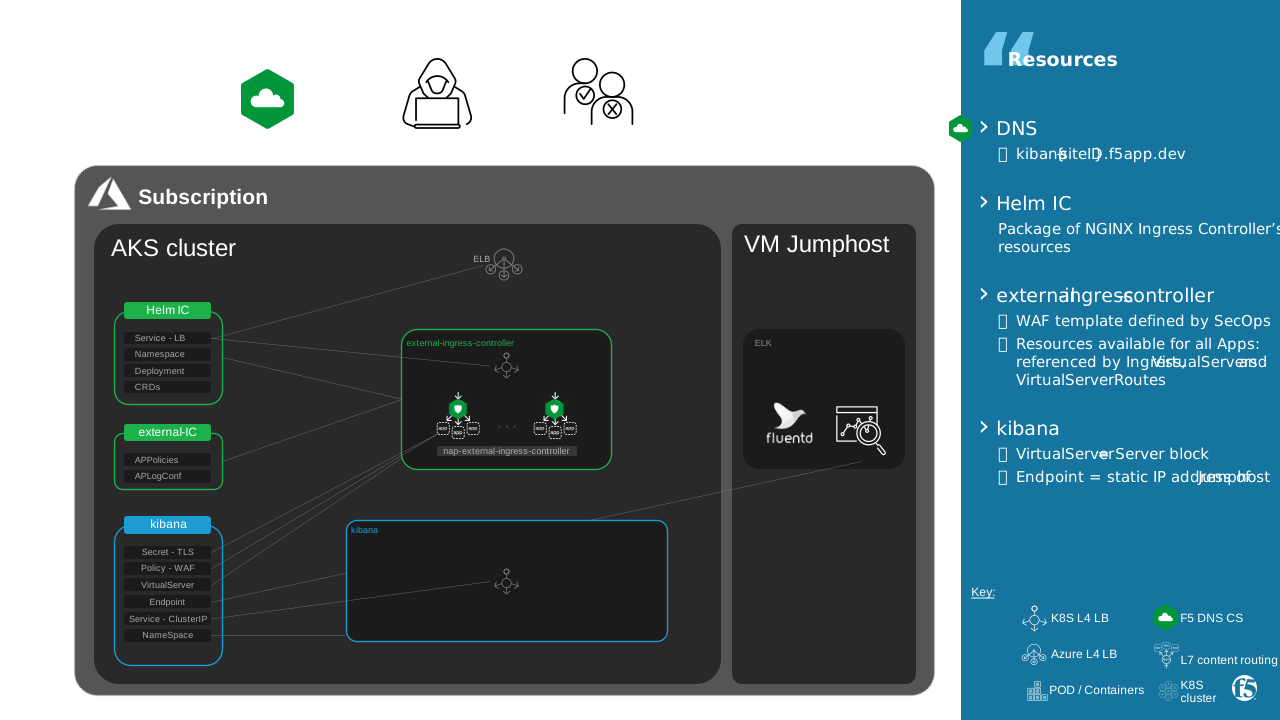
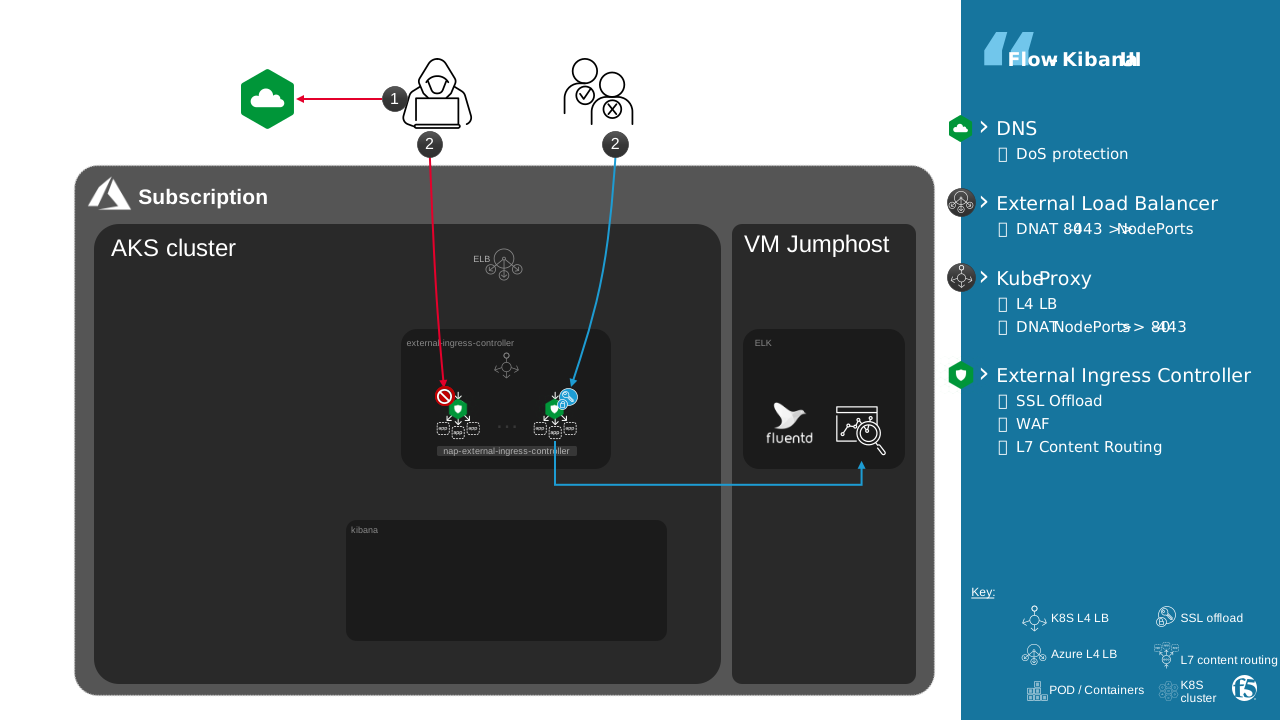
Kibana is protected by NGINX App Protect embedded in Ingress Controller.
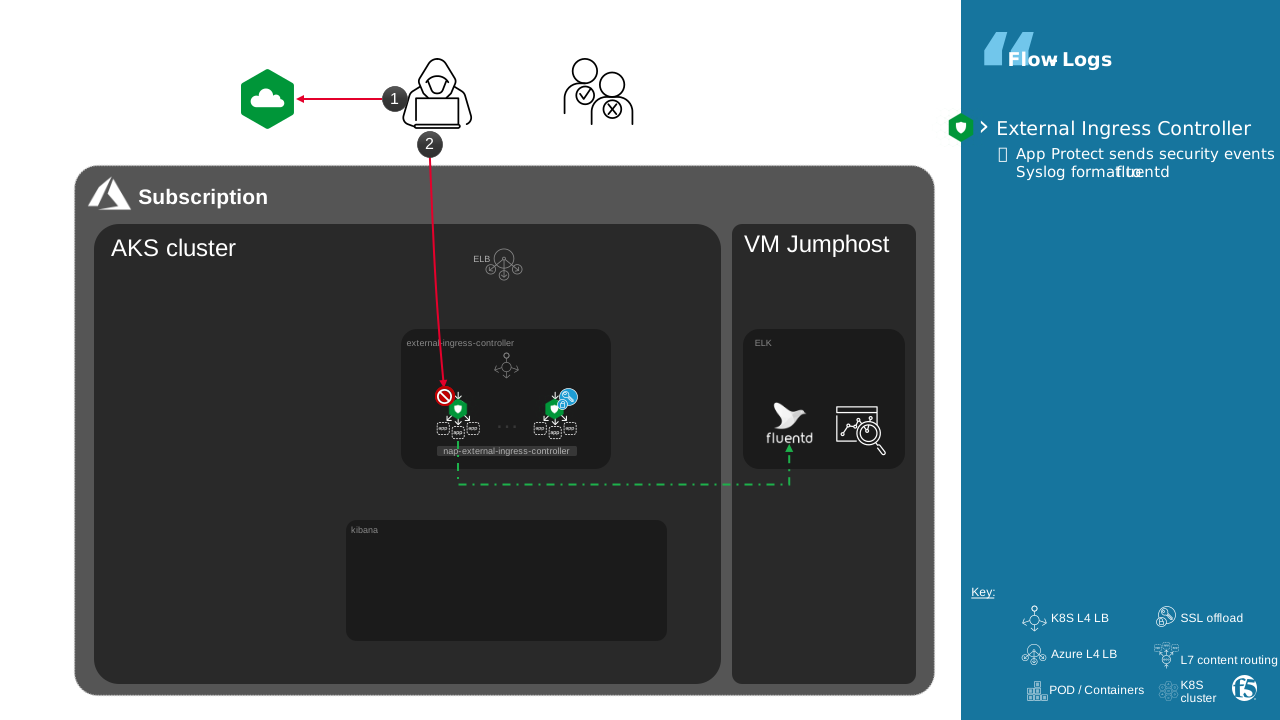
Security events logs are sent to ELK.
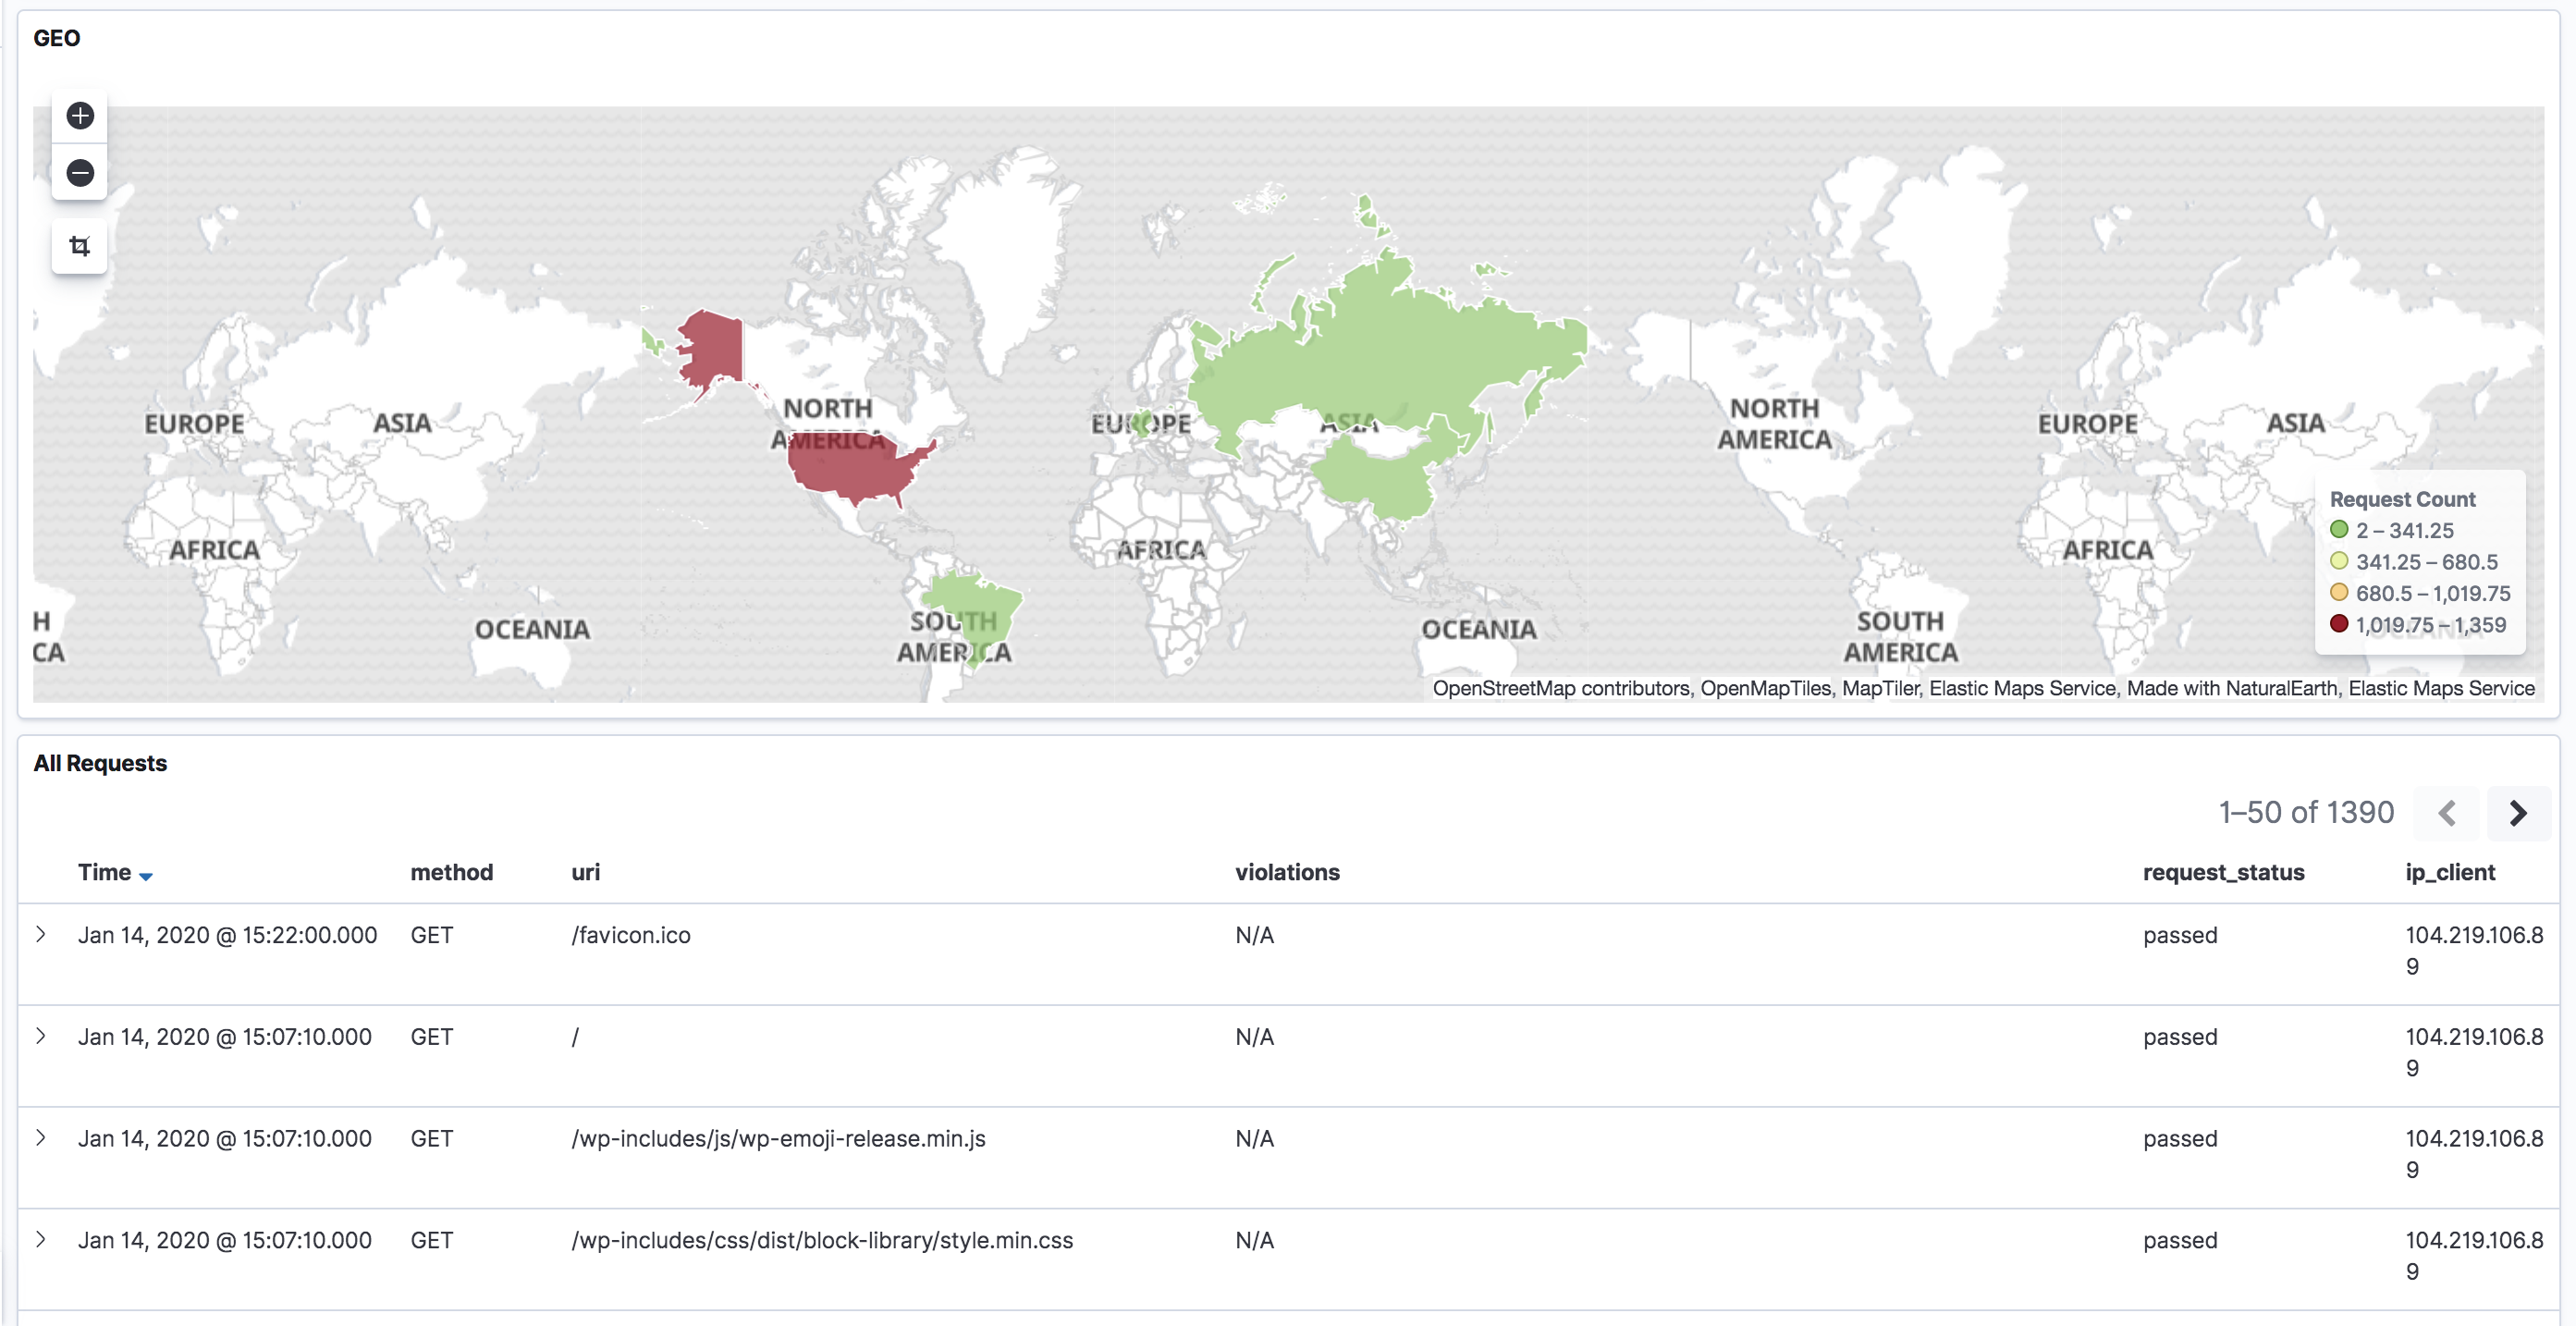
Security dashboards are available on Kibana. Mode details here
Using your web browser, try to reach ELK UI
https://kibana{{site_ID}}.f5app.dev… Damn it’s DOWN!Restart the container using docker commands
docker ps
output
CONTAINER ID   IMAGE          COMMAND                  CREATED      STATUS      PORTS                                                                                                                                                 NAMES
3c87d89ab528   sebp/elk:742   "/usr/local/bin/star…"   5 days ago   Up 3 days   0.0.0.0:5144->5144/tcp, :::5144->5144/tcp, 0.0.0.0:5601->5601/tcp, :::5601->5601/tcp, 5044/tcp, 9300/tcp, 0.0.0.0:9200->9200/tcp, :::9200->9200/tcp   f5-waf-elk-dashboards_elasticsearch_1
Note your {{CONTAINER_ID}} and restart it
docker restart {{CONTAINER_ID}}
Wait 3mn then browse ELK UI
https://kibana{{site_ID}}.f5app.dev>> Dashboard >> Overview and scroll toAll Requests
Extra time: Cryptonice
Cryptonice collects data on a given domain and performs a series of tests to check TLS configuration and supporting protocols such as HTTP2 and DNS.
On Jumphost, evaluate SSL security for
https://kibana{{site_ID}}.f5app.dev
docker run -v `pwd`:`pwd` -w `pwd` -i -t f5labs/cryptonice kibana{{site_ID}}.f5app.dev --json_out --no_console
output
Pre-scan checks
-------------------------------------
Scanning kibana1.f5app.dev on port 443...
Analyzing DNS data for kibana1.f5app.dev
Fetching additional records for kibana1.f5app.dev
kibana1.f5app.dev resolves to 20.75.112.65
20.75.112.65:443: OPEN
TLS is available: True
Connecting to port 443 using HTTPS
Reading HTTP headers for kibana{{site_ID}}.f5app.dev
Queueing TLS scans (this might take a little while...)
Looking for HTTP/2

Scans complete
-------------------------------------
Total run time: 0:00:03.059256

Outputting data to ./kibana{{site_ID}}.f5app.dev.json
View evaluation results
cat kibana{{site_ID}}.f5app.dev.json | jq .
Capture The Flag
extra 1.1 What is the supported cipher suite?